
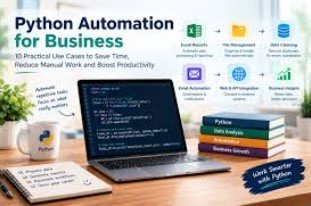
Every Monday morning loads of analysts go through the same rigmarole. They download the sales, paste the numbers into a spreadsheet, format it, build the charts and then email a summary to the managers. It can take several hours a week doing it the old fashioned way and there’s always the risk of making a mistake. Python offers a very sensible way of automating the whole process. A very small number of well written scripts can pull the data, clean it, produce a summary and then email it out to the relevant people on a regular basis. This article looks at how each of those stages works and what you need to do it.
Why Automate Weekly Reporting?
Manual reporting has three major problems really. It takes a long time. It’s entirely dependent on one person being available to do it. And it’s extremely prone to human error. A single wrong cell reference can completely change a revenue figure and that in turn leads to bad decisions.
Automation deals with that. A Python script will run the exact same steps in the exact same order every time. It gives you a consistent output, it keeps a record of what it’s done and it frees the analysts to go and actually analyse the results rather than just put them together.
Step 1: Collecting Data from Multiple Sources
Business data is almost never in one place. A typical weekly report will be pulled from a database, a CRM, a finance spreadsheet and a web analytics tool.
Python handles all of these sources well:
- Databases: SQLAlchemy can connect to MySQL, PostgreSQL and SQL Server. You can run a query and load the results directly into a pandas DataFrame using pd.read_sql().
- Files: pandas can read in CSV and Excel files via pd.read_csv() and pd.read_excel().
- APIs: the requests library fetches the data from the web service (typically in JSON format) and pandas can then turn that into a table.
It’s good practice to store your connection details (passwords, API keys etc) in environment variables or a separate config file rather than in the script itself.
Step 2: Cleaning and Transforming the Data
Raw data is almost always full of gaps, duplicates and all sorts of inconsistent formats. Cleaning is where you’re going to get the biggest benefit from automation as you’re going to be doing the same thing every week.
Common cleaning tasks in pandas include:
- Removing duplicate rows via drop_duplicates().
- Deal with missing values using either fillna() or dropna() as appropriate in accordance with the business rules.
- Converting text dates into proper date types using pd.to_datetime().
- Standardise the category names (i.e. ‘north’, ‘North’ and ‘NORTH’ all become ‘North’) using str.strip() and str.title().
After the cleaning you turn the data into summary metrics. Groupby() will give you the totals and averages by region, by product, by team. You can also do a comparison of the current week with the previous week to show a % change which enables the reader to spot trends at a glance.
Simple validation checks are a absolute necessity. The script could for instance check that total revenue isn’t negative, or that the row count is in the expected range. If a validation fails it can simply stop and let the analyst know rather than sending out the wrong numbers.
Learners on the data analyst course in Delhi are going to be using those exact Pandas techniques on real business datasets as part of their course work – cleaning is such a fundamental part of a data analyst’s job.
Step 3: Building and Distributing the Summary
Creating the Report
- Excel output: the openpyxl or XlsxWriter libraries will produce properly formatted workbooks with multiple sheets, bold headers and number formats.
- Charts: either Matplotlib or Seaborn can be used to produce line and bar charts which can then be saved as images and inserted into the report.
- HTML or PDF: Jinja2 templates are used to generate an HTML summary which can be converted to PDF if required.
Sending the Report
Python’s built-in smtplib and email modules will of course send messages with attachments via your company mail server. A lot of companies will also be using Microsoft Teams or Slack and both of those platforms support webhooks which can accept messages from a script.
Scheduling the Script
Automation is complete when the script runs unattended. On Windows you’d use Task Scheduler to run the Python script at a particular time each week. On Linux and Mac you’d use cron. Larger teams are likely to be using a workflow tool such as Apache Airflow which will manage the dependencies and allow you to retry failed tasks.
Best Practices for Reliable Automation
- Log every run. Use Python’s logging module to log the start time, the number of rows and any errors.
- Version your code. Store your scripts in Git so that you can track every change.
- Test it with some sample data and make sure the outputs match your manual calculations before you do anything else.
- Keep functions small. Have separate functions for collection, cleaning and distribution so the code is easier to maintain.
Conclusion
Python takes the weekly reporting completely over. If you’ve got the script in place for data collection, data cleaning, report creation and distribution then it’s a huge time saver and you end up with a very consistent, reliable weekly summary. It’s a skill that employers are always looking for and a good data analyst course in Delhi will help the novice build it up through a series of projects and practical work.
